

21st-century living has brought us new technologies. These technologies can help us harness the power of light to detect solar heat and form images of the Earth. This innovative technology goes by the name optical remote sensing.
In fact, different materials reflect and absorb light at different wavelengths. What’s more, objects can be differentiated based on the reflection of emitted wavelengths that optical remote sensing technologies display in each remotely sensed image. Nevertheless, optical remote sensing carries with it great potential for a variety of industries. Some of those industries include the automotive industry, environmental sustainability, and urban planning for civic life.
Businesses and industrial specialists: If you’re curious about how optical remote sensing technology can help you, you’ve come to the right place.
We’re GlobalMRV, sustainability consultants and emissions analysts for the world’s leading equipment manufacturers, universities, product development teams, and sustainability businesses. With more than 15 years of experience in emissions monitoring and reporting, we produce emissions monitoring, reporting, and verification tools that help businesses create leaner, greener, and cleaner products.
Join us! In this article, we’ll walk you through the following optical remote sensing topics, such as:
- What is optical remote sensing?
- What types of optical remote sensing technologies exist?
- Data and indices that optical remote sensing technology can provide
- Optical remote sensing technology and its application to vehicle emissions monitoring
- Where to find quality vehicle emissions control products that harness optical remote sensing
What is optical remote sensing technology?

Optical remote sensors are a key primary data source for analysis. Optical remote sensing technology collects incident electromagnetic (EM) radiation and converts it to a representation. This representation is used for remote sensing analysis in a variety of industrial applications.
What’s more, optical imaging sensors sample the EM field in four different ways:
- Spatial imaging
- Spectral imaging
- Radiometric imaging
- Temporal imaging
The result is a radiant image of a particular landscape. Some of the most common landscapes in which optical remote sensing is used include:
- Agricultural spaces
- Roads and buildings in urban spaces
- Rural landscapes, such as large bodies of water, plains, bare soil, and forest
- Real-driving environments
Types of optical remote sensing systems (plus examples)

Some of the most common optical remote sensing systems include:
- Panchromatic imaging systems: These sensors and systems are sensitive to radiation within a broad wavelength range. The visible range of light that falls within this wavelength range is portrayed using black and white colors. The amount of color contrast, the brightness and darkness between white and black objects in the image, represents the targeted objects being measured. Images, alas, aren’t displayed in the full range of colors on the electromagnetic spectrum. A few examples where panchromatic imaging systems are used include satellite remote sensing and aerial photography. Since red, green, and blue bands are used, the intensity of solar radiation is higher in every pixel, all while keeping images in greyscale.
- Multispectral imaging systems: These types of optical remote sensing systems use multiple channels with a few spectral bands. Each channel is sensitive to radiation within a narrow wavelength band. Nevertheless, smaller amounts of light energy are available in multispectral bands. Multispectral detectors sample larger areas, which means larger pixels and smaller spatial resolution for each image rendered. Examples where multispectral imagery may be used are in medical diagnostics, artifact analyses, monitoring the health & growth of various plants, and potentially renewable energy audits.
- Superspectral imaging systems: Superspectral imaging systems contain more than 10 bands, often up to 100 bands, of color. Similar to multispectral imaging systems, they capture spectral characteristics of targets but on a finer, more granular level. By imaging in more frequent and numerous bands, users can identify trace amounts of a target. Superspectral imaging is often used to trace trace amounts of fluids, fingerprints, and blood flow around an injury.
- Hyperspectral imaging systems: This system captures hundreds of spectral bands. The information from these bands allows users even more precise information about the character and identity of a particular target. A few examples of hyperspectral imaging include mapping mineral deposits, identifying soil moisture content and nutrient content, and identifying particle size and makeup of exhaust plumes.
Solar irradiation: The source of illumination for optical data
With each type of spectral imaging system listed above, solar power is used to help illuminate targets for optical data analysis. Before the heat and light of the sun pass through the Earth’s atmosphere, its source temperature is about 10,160°F. A peak intensity of about 500 nanometers of wavelength hit the Earth’s surface.
And yet, after passing through the atmosphere, significant energy at the ground remains with 0.25 to three micrometers.
Why is this information important? Because 0.25 to three micrometers provides the right illumination for optical sensing technology to identify the makeup of its target(s) in question.
Without solar irradiation, optical remote sensing technology wouldn’t provide us with the actionable insights we need to make better decisions for our planet and our people.
Spectral reflectance signature information
Other information that helps optical and radar remote sensing technology function is what’s called spectral reflectance signature information. Since different materials reflect and absorb solar radiation at different wavelengths, the wavelengths that reflect back include the fraction of the incident wavelength.
Therefore, the unique signature of the material is the target being observed by spectral imagery. What’s more, if an optical remote sensing technology has enough spectral resolution, it has the capability to distinguish between different wavelengths of light and from materials that reflect back different wavelengths of light.
In other words, multispectral remote sensing technologies distinguish between different light wavelengths in different materials to provide clear actionable data. What’s more, different materials — like water, soil, vegetation, exhaust fumes, and more — reflect a different proportion of light and energy.
Using industry-grade spectrometers, spectrophotometers, and optical remote sensors to measure and analyze light properties is paramount to making more informed decisions and ensuring a more successful, functional, and compliant operation.
Applications of optical remote sensing images

Which applications of remote sensing technology exist? Optical remote sensing technology is often used in the following situations:
- Infrastructure and land use planning: By combining optical images of a piece of land or infrastructure from different angles, urban planners, architects, and civic planning teams can use optical remote sensing to capture images that reflect the elevation of land in certain areas. Digital elevation models (DEMs) help teams better monitor and make use of land for their needs.
- Mapping: Mapping the Earth’s surface with satellite data is one of the most widely-known applications of optical remote sensing technology. Google Maps and Apple Maps use optical remote sensing technology to help us view features and detect changes in topography. Mapping has even been used to help discover remote islands that were never known to exist (hello, Landsat Island).
- Vegetation management and agriculture: Monitoring threats to vegetation can be challenging, especially for large swaths of farmland. Satellite imagery allows companies to analyze thousands of miles of land. The analysis helps ensure, for example, more evenly distributed irrigation, fertilization, and crop yield for a piece of land.
- Coastal monitoring: Environmental specialists monitor the rise of sea levels or the risk of flooding with a sub-category of optical remote sensing called optical satellite image and data analysis.
- Vehicle emissions analysis: To analyze exhaust plumes, smoke, and primary & secondary pollutants emitted from the tailpipes of internal combustion engine (ICE)-powered vehicles and infrastructure for cleaner and more efficient automobile product development.
From the most remote polar landscapes to agricultural soil efficiency testing to roadside screening of vehicles to flag high-emission vehicles in busy metropolises, optical remote sensing helps industrial specialists make more calculated decisions that benefit our planet.
Data that optical remote sensing can provide
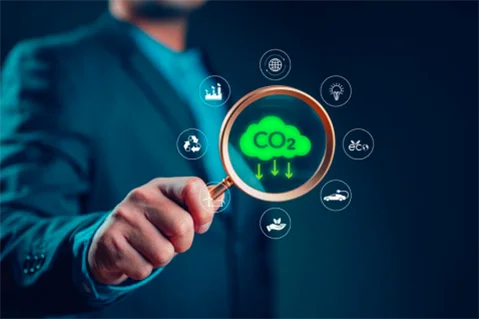
The data and indices that industrial specialists glean from remote sensing imagery and optical sensors includes:
- Textures and contours of geographical locations
- Cloud cover over a particular land mass or body of water
- Density of biomass, including soil composition, availability of moisture, and chlorophyll absorption of various plant masses
- Composition make-up of vehicle-based exhaust plumes and industrial plant-produced smoke
- Emitted electromagnetic energy from Earth’s surface and atmosphere using spaceborne optical sensors to track and monitor the rate of deforestation, urban sprawl, changes in water quality, and damage done due to natural disasters and climate change.
- And more
In essence, optical remote sensing technology helps teams unearth the make-up, density, and changes of various targets to help make visible substances that aren’t visible to the naked eye.
An example: Optical remote sensing technology for vehicle emissions monitoring

Let’s take a look at ]how optical remote sensing technology works.
By using thermal infrared, near infrared, and ultraviolet light beams, research teams can use optical remote sensing systems to project beams of light on a particular area. A vehicle can then drive past this beam of light, and the pollutants emitted from the tailpie of the vehicle absorb specific wavelengths, allowing the system to calculate the concentration of key pollutants (like carbon monoxide, carbon dioxide, nitrogen oxides, hydrocarbons, ammonia, and particulate matter).
With the use of speed sensors, weather instruments, and artificial intelligence and machine learning, research and product development teams can use the data produced by the systems to adapt, iterate, or pursue new directions in product and/or environmental design.
Need reliable vehicle emissions data built with optical remote sensing?

Optical imagery plays an important role in pollutant detection and so much more. The spectral information provided is key to stakeholders, particularly in the automotive industry.
As such, teams are finding themselves using remote sensing to help them better visualize the composition and make-up of particulate matter that can affect the quality of their vehicles. In other words, the right equipment can help you make better decisions for your team.
For example, industrial specialists use our portable emissions measurement systems (PEMS) to investigate the exhaust emissions of dual fuel, gasoline, diesel, and hybrid vehicles. In the last eight years alone, we’ve collected more than 9,000 hours of reliable data for vehicle emissions testing and helped save original equipment manufacturers (OEMs) and companies more than $12,000,000 on traditional dynamometer and real driving emissions (RDE) testing using optical remote sensing-enhanced technology.
If you’re curious to see what optical remote sensing-enhanced vehicle emissions and analytics technology looks and feels like, we invite you to get in contact with our team. We look forward to helping you create a cleaner and more profitable future for our planet.
GlobalMRV: Emissions Monitoring & Reporting Solutions Built On Optical Remote Sensing Technology